

Statistics
Estimated civilian death toll of Japan during WW2
Updated on the 20th of September 2023

We will analyse the demographics of Imperial Japan on Wikipedia to come to an estimated death toll of the Japanese civilians
during World War 2. Robert McNamara, who was captain in the US Airforce in 1943, confesses in this documentary and states that they killed 50% to 90% of the Japanese population by firebombing and conventional
bombs of all 67 Japanese cities. Because Japanese housing culture focuses on light burnable material the fire bombings caused
much suffering and destruction in Japan. This was a brutal war of genocide against the Japanese people. The Japanese got the
messages of the Third Reich high command that the Allies were destroying all of Germany and that this too would be the faith
of Japan. The Japanese knew that they too were targeted for extermination. That is why the Japanese fought the bitter end even sacrificing their lives in Kamikaze attacks. Only after the targeted nuclear bombing of Hiroshima and Nagasaki that Japan capitulated to the Allies. According to revisionists the death toll of the Third Reich during and after the war is estimated at 29 million Germans. We will use this as a reference.
The Interview of Robert McNamara can seen here: The Fog of War Documentary
Table of Demographics of Imperial Japan
| Date | Population | % Change | Area (km2) | Density(km2) | %Urban |
| 1920-10-01 | 55,963,053 | NA | 381,808.04 | 147 | 18.0 |
| 1925-10-01 | 59,736,822 | 6.7 | 381,810.06 | 156 | 21.6 |
| 1930-10-01 | 64,450,005 | 7.9 | 382,264.91 | 169 | 24.0 |
| 1935-10-01 | 69,254,148 | 7.5 | 382,545.42 | 181 | 32.7 |
| 1940-10-01 | 73,114,308 | 5.6 | 382,545.42 | 191 | 37.7 |
| 1945-11-01 | 71,998,104 | -0.7 | 377,298.15 | 195 | 22.8 |
Source: Demographics of Imperial Japan + Wikipedia
We will use the population of the count of 1940 to assess how many Japanese men, women and
children died during the saturation bombing of all Japanese cities during World War 2.
Wikipedia states that only around 1 Million people died because of the war. From experience
we know that the Zionist Allies and Zionist Soviet Union covered up their war crimes
against Humanity. The Zionist Jews keep lying on the greatest war crimes that happened and
keep parroting their lies through the Zionist controlled press. Revisionist historians have
estimated the German death toll during and after the war at 29 million. The webmaster’s
estimate will also be an estimate based on computations of demographics and historical data. And the available data of the Fog of War documentary. The fog of war documentary states that around 50% to 90% of the people of 67 Japanese cities died by burning.
Let us assume that 80% of urban population lived in the 67 Japanese cities at the time of the bombing of Japan. Robert McNamara states in the documentary that they killed hundreds of thousands of people every night. This was a brutal war of genocide against the Japanese people.
| Population of Japan 1940 | Living in cities in 1940 | 80% in 67 Japanese cities | 50% death toll | 90% death toll |
| 73,114,208 | 27,564,094 | 22,051,275 | 11,025,638 | 19,846,148 |
So the minimum number of casualties in this computation is 11 million, and the maximum is around 20 million civilian deaths in Japan during World War 2. Around 15 million Japanese civilians died during World War 2. This is not covered by the statistical bureau because it is the victors that write history and always show us that the so called “good” guys won World War 2. They lied to us about the Third Reich. They lie to us about virtually everything on World War 2. Adolf Hitler never wanted war, it was forced upon him by the International Zionist Banksters under leadership of the Rothschilds.
Imperial Germans Exodus World War 2: Table of transport capacity
| Transport capacity in persons | Number of units available | Transport capacity | Velocity | |
| Haunebu I | 20 | 2 | 40 | 4800 |
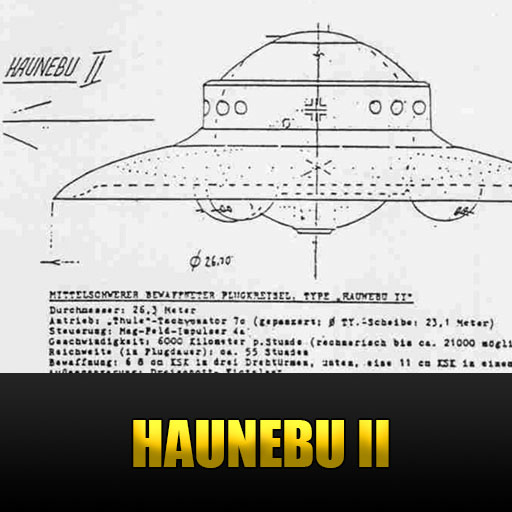
| Haunebu II | 20 | 7 | 140 | 6000 |
| Haunebu III | 70 | 1 | 70 | 7000 |
| Andromeda Device | 100 | 1 | 100 | 7000 |
| U-Boats | 5 | 10 | 50 | 23 |
| Number of hours for round trip | Number of days | Number of roundtrips per year - 15% maintenance | Number of passengers transported per year | Materials transported 45% | People minus materials | |
| Haunebu I | 8 | 0,35 | 894 | 35741 | 16083 | 19657 |
| Haunebu II | 7 | 0,28 | 1117 | 156366 | 70365 | 86001 |
| Haunebu III | 6 | 0,24 | 1303 | 91214 | 41046 | 50167 |
| Andromeda Device | 6 | 0,24 | 1303 | 130305 | 58637 | 71668 |
| U-Boats | 2000 | 83 | 4 | 214 | 96 | 118 |
| Total | 416839 | 186228 | 227612 |
Distance to the Inner Earth New Swabia and Germany is around 20'000 km.
The Imperial Germans with what they had available in 1944 could have transported around 200’000 persons and materials to the Inner Earthen Colony of New Swabia in one year. If we assume an annual growth rate of 7% per year. The doubling time of the population is 70/7 = 10 years.
| Year | Population |
| 1945 | 200'000 |
| 1955 | 400'000 |
| 1965 | 800'000 |
| 1975 | 1'600'000 |
| 1985 | 3'200'000 |
| 1995 | 6'400'000 |
| 2005 | 12'800'000 |
| 2015 | 25'600'000 |
So New Berlin could have a population of 3.5 million inhabitants. If we take an annual growth rate of 7% then today's Imperial German population would be around 25 million.
World War 2 in numbers
By the end of the war the United States alone would have produced over 200'000 combat aircraft of which 95'000 were bombers, 100'000 fighters and 5'000 reconnaissance aircraft. Over 150 German cities were firebombed during World War 2. 67 Japanese cities were firebombed during World War 2 where after Hiroshima and Nagasaki were destroyed with nuclear weapons. This horrendous genocidal bombing campaign killed millions of German and Japanese men, women and children. According to revisionist historians the estimated death toll of the Third Reich ammounted to 29 Million during and after the war. The Japanese suffered an estimated 13 Million dead. This genocide of German and Japanese civilians is suppressed to this day and not confirmed by mainstream historians. Only the bombing of Dresden and the nuclear bombing of Hiroshima and Nagasaki are known.
Total combat-aircraft production of the Allies during WW2.
Source: Wikipedia + US Aircraft production during WW2
| Type of aircraft | Total | 1940¹ | 1941 | 1942 | 1943 | 1944 | 1945² |
| Grand total | 295,959 | 3,611 | 18,466 | 46,907 | 84,853 | 96,270 | 45,852 |
| Combat aircraft | 200,443 | 1,771 | 8,395 | 24,669 | 53,183 | 74,564 | 37,861 |
| Very heavy bombers | 3,740 | — | — | 4 | 91 | 1,147 | 2,498 |
| Heavy bombers | 31,685 | 46 | 282 | 2,513 | 9,574 | 15,057 | 4,213 |
| Medium bombers | 21,461 | 52 | 762 | 4,040 | 7,256 | 6,732 | 2,619 |
| Light bombers | 39,986 | 453 | 2,617 | 5,954 | 11,848 | 12,376 | 6,738 |
| Fighters | 99,465 | 1,157 | 4,036 | 10,721 | 23,621 | 38,848 | 21,082 |
| Reconnaissance | 4,106 | 63 | 698 | 1,437 | 793 | 404 | 711 |
| Support aircraft | 95,516 | 1,840 | 10,071 | 22,238 | 31,670 | 21,706 | 7,991 |
| Transports | 23,900 | 164 | 525 | 1,887 | 6,913 | 9,925 | 4,486 |
| Trainers | 58,085 | 1,676 | 9,294 | 17,237 | 20,950 | 7,936 | 1,352 |
| Communication | 13,531 | — | 252 | 3,114 | 4,167 | 3,845 | 2,153 |
Total combat-aircraft production of the Allies and Axis during World War 2.
Source: Wikipedia + Military production during World War 2
| Power | Total Aircraft | Fighters | Attack | Bombers | Recon | Transport | Training | Other | Personnel |
| British Empire | 177,025 | 38,786 | 33,811 | 38,158 | 7,014 | 12,585 | 46,256 | 415 | 1,927,395 |
| USA and territories | 295,959 | 99,465 | 96,872 | 4,106 | 23,900 | 58,085 | 13,531 | 2,403,806 | |
| USSR | 136,223 | 22,301 | 37,549 | 21,116 | 17,332 | 4,061 | 33,864 | ||
| Other | |||||||||
| Allies | 609,207 | 160,552 | 71,360 | 156,146 | 11,120 | 53,817 | 108,402 | 47,810 | |
| Germany and territories | 133,387 | 57,653 | 8,991 | 28,577 | 5,025 | 8,396 | 14,311 | 11,361 | 3,402,200 |
| Romania | 1,113 | 513 | 272 | 128 | 0 | 200 | 0 | 0 | |
| Italian Empire | 13,402 | 9,157 | 34 | 3,381 | 388 | 2,471 | 968 | 3 | |
| Japanese Empire | 64,484 | 33,405 | 9,558 | 11,943 | 3,709 | 1,073 | 3,420 | 1,376 | |
| Other | 9,849 | 881 | 4 | 395 | 318 | 1,880 | 5,145 | 57 | |
| Axis | 222,235 | 98,609 | 18,859 | 44,424 | 11,002 | 14,020 | 22,944 | 12,794 |
Total naval production of the Axis and Allies during World War 2
Source: Wikipedia + Military production during World War 2
| Power | Total large ships | Carriers (Escort Carriers) | Battle- ships | Cruisers | Des- troyers | Frigates & Destroyer Escorts | Other large vessels | Cor- vettes | Sloops | Patrol boats | Submarines |
| British Empire | 558 | 15 (29) | 5 | 35 | 202 | 270 | 2 | 338 | 33 | 4,209 | 238 |
| USA and territories | 2020 | 29 (121) | 10 | 52 | 396 | 1014 | 398 | 773 | 234 | ||
| USSR | 63 | 0 | 6 | 54 | 3 | 68 | |||||
| France | 9 | 2 | 7 | ||||||||
| Other | 8 | (2) | 2 | 4 | 1 | 9 | |||||
| Allies | 2658 | 44(152) | 17 | 95 | 663 | 1284 | 403 | 338 | 34 | 4,982 | 577 |
| Germany & territories | 38 | 0 | 4 | 3 | 31 | 1,019 | |||||
| Italian Empire | 82 | 0 | 3 | 3 | 17 | 59 | 83 | ||||
| Japanese Empire | 278 | 14(6) | 2 | 12 | 63 | 175 | 6 | 867 | |||
| Romania | 8 | 2 | |||||||||
| Axis | 398 | 14(6) | 9 | 18 | 111 | 234 | 6 | 2069 |
Total army production of the Axis and Allies during World War 2
Source: Wikipedia + Military production during World War 2
| Power | Tanks & SPGs | Armoured vehicles | Other vehicles | Artillery | Mortars | Machine guns | Personnel |
| British Empire | 47,862 | 47,420 | 1,475,521 | 226,113 | 239,540 | 1,090,410 | 11,192,533 |
| USA and territories | 108,410 | 2,382,311 | 257,390 | 105,055 | 2,679,840 | 16,000,000 | |
| USSR | 119,769 | 197,100 | 516,648 | 200,300 | 1,477,400 | 34,401,807 | |
| Other | |||||||
| Allies | 270,041 | 47,420 | 4,054,932 | 1,000,151 | 544,895 | 5,247,650 | 61,594,000 |
| Germany and territories | 67,429 | 49,777 | 159,147 | 73,484 | 674,280 | 1,000,730 | 14,540,835 |
| Hungary | 973 | 530 | 5,224 | 447 | 2,700 | 4,583 | 730,000 |
| Romania | 214 | 251 | 4,300 | 1,800 | 4,300 | 10,000 | 1,220,000 |
| Italian Empire | 3,368 | 1,240 | 83,000 | 7,200 | 22,000 | 140,000 | 4,300,000 |
| Japanese Empire | 4,524 | 2,200 | 165,945 | 13,350 | 49,000 | 380,000 | 8,100,000 |
| Other | |||||||
| Axis | 76,385 | 50,028 | 413,316 | 97,281 | 725,280 | 1,395,313 | 28,890,800 |